RML Tutorials and Examples

We have a public Mercurial repository which you can browse online and clone 5 mini projects locally to play with. Our full test suite of RML examples is also included
To pull this down, run this command,
hg clone https://hg.reportlab.com/hg-public/rlextra-examples/
then look at the README.
If you are stuck behind a firewall, our Mercurial repo has a link download a zip file
https://hg.reportlab.com/hg-public/rlextra-examples/archive/tip.zip
1) rml_tests/ - Our full test suite of RML examples.
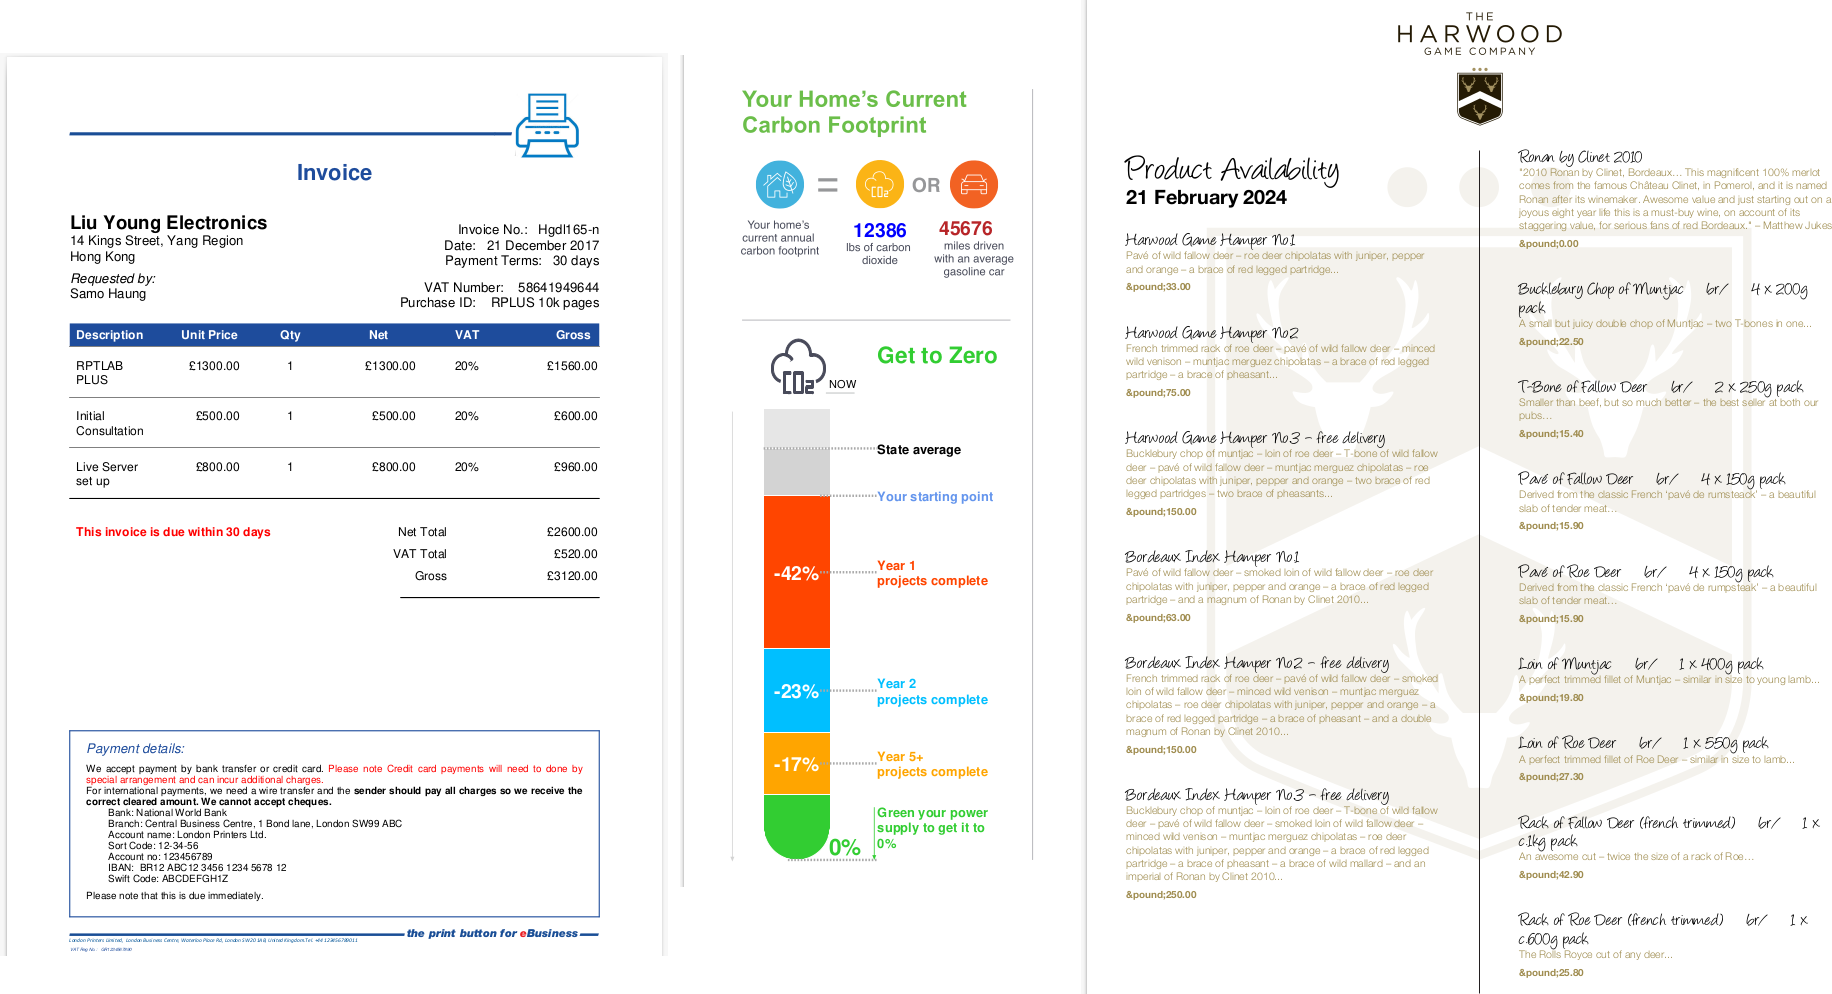
2) invoice/ - A simple JSON to PDF project which is the standard way ReportLab deploys a solution which accepts JSON input and produces PDF output.
3) product_catalogue/ - An XML product listing converted to a fully customisable PDF in seconds.
4) graphic_card/ - This shows the use of reportlab/graphics to make a very simple "image card",
5) fundfacts/ - A Django project with some sample data and a landscape PDF report showing the techniques to create tables, charts and various types of content in our framework.
6) retrofitzero/ - A complex JSON to PDF project with a custom Diagra chart and PageCatcher examples.
RML Samples
This page illustrates all the RML files in our ReportLab rml2pdf test suite. This page will be updated daily from our svn repository and will therefore include any new features of RML. The files listed below are the same as our rlexra/rml2pdf/test directory and the RML user guide to get the full picture on how to use RML effectively.
Side by side
Below are some side by side RML and the respective PDF output. For more examples, please use the download table.
| test_000_simple.rml | test_000_simple.pdf |
|---|---|
| test_006_barcodes.rml | test_006_barcodes.pdf |
|---|---|
| test_044_codesnippets.rml | test_044_codesnippets.pdf |
|---|---|
Download table
Please note that from time to time some of the test suite may fail as we are subjected to upgrade or modify our rml2pdf engine for improvements.