Pricing
DOCS
CASE STUDIES
SUPPORT
ABOUT
SIGN-IN
SIGN UPx
SIGN-IN
Toggle Dropdown
SIGN UP
Line charts
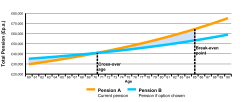
LinePlot with annotations
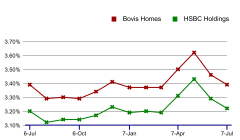
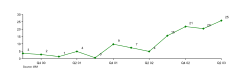
Line with markers (serious)
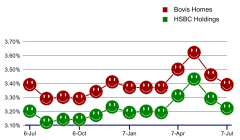
Line with markers (silly)
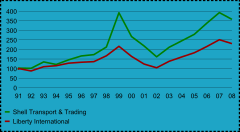
Chart with background color
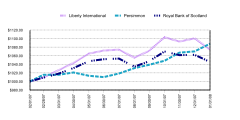
Dashed lines and number formats
The line chart has a marker point
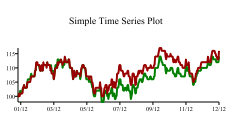
Time Series Plot
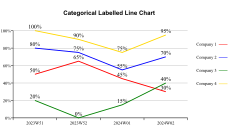
Categorical Labelled Line Chart
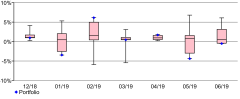
A dispersion chart; data is date boxlo boxmid boxhi hi inv
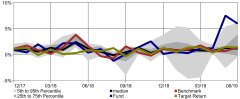
Line chart with area percentiles
ReportLab Chart Galleries
Area
Line
Pie
Bar
Quickcharts
Scatter